apsware

You can't manage
what you can't observe.

apsware observer – your visibility for scheduler executions. A real-time visualization for all your job flows, across schedulers.

Single or multiple schedulers. A clear view from day one whether you run one scheduler or five.

No real expertise required. You can track what’s running or not – in seconds.

Single pane of glass. One view across your entire automation landscape.

Automation grew.

Visibility didn't.

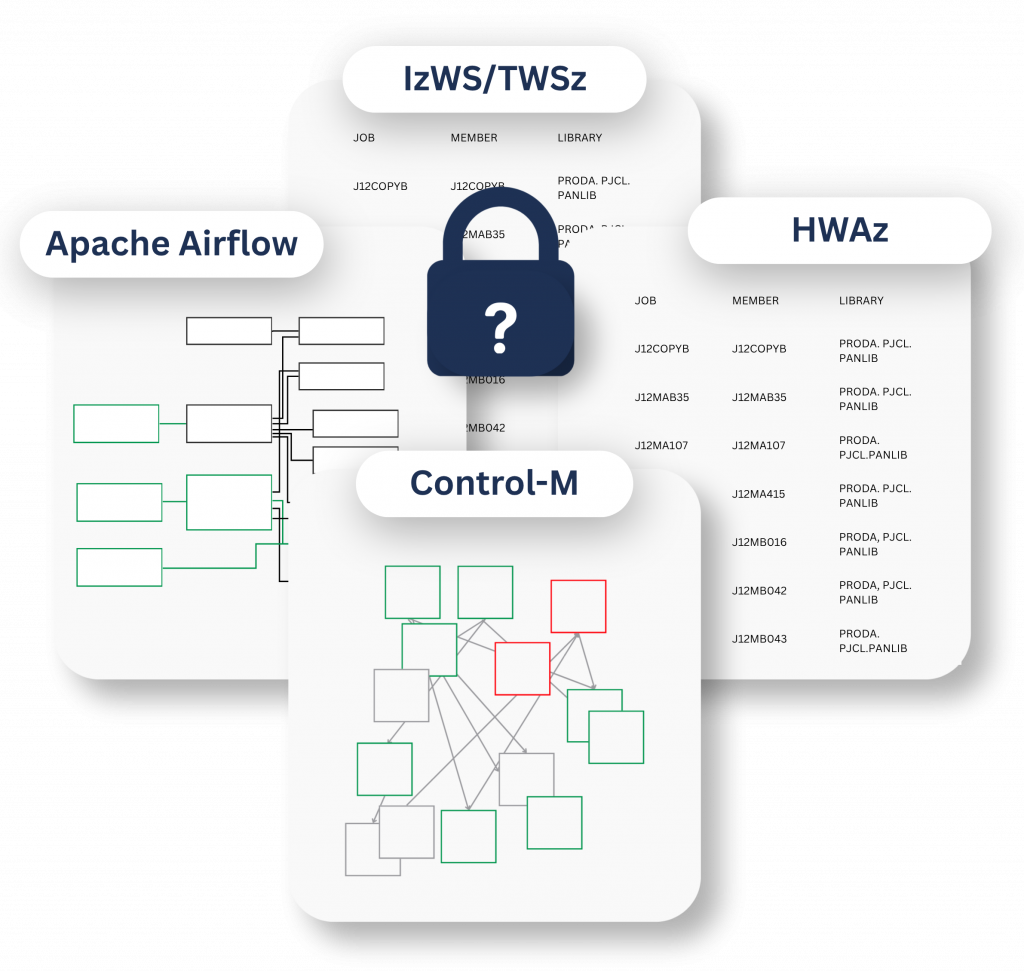
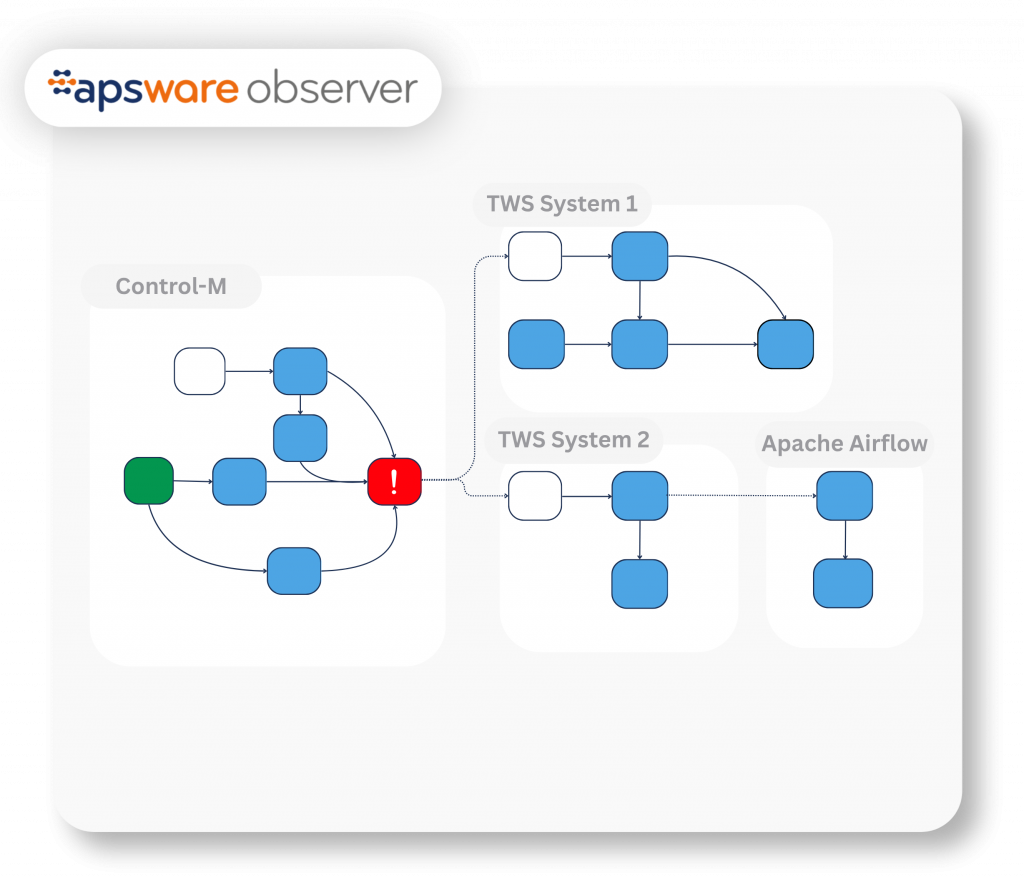
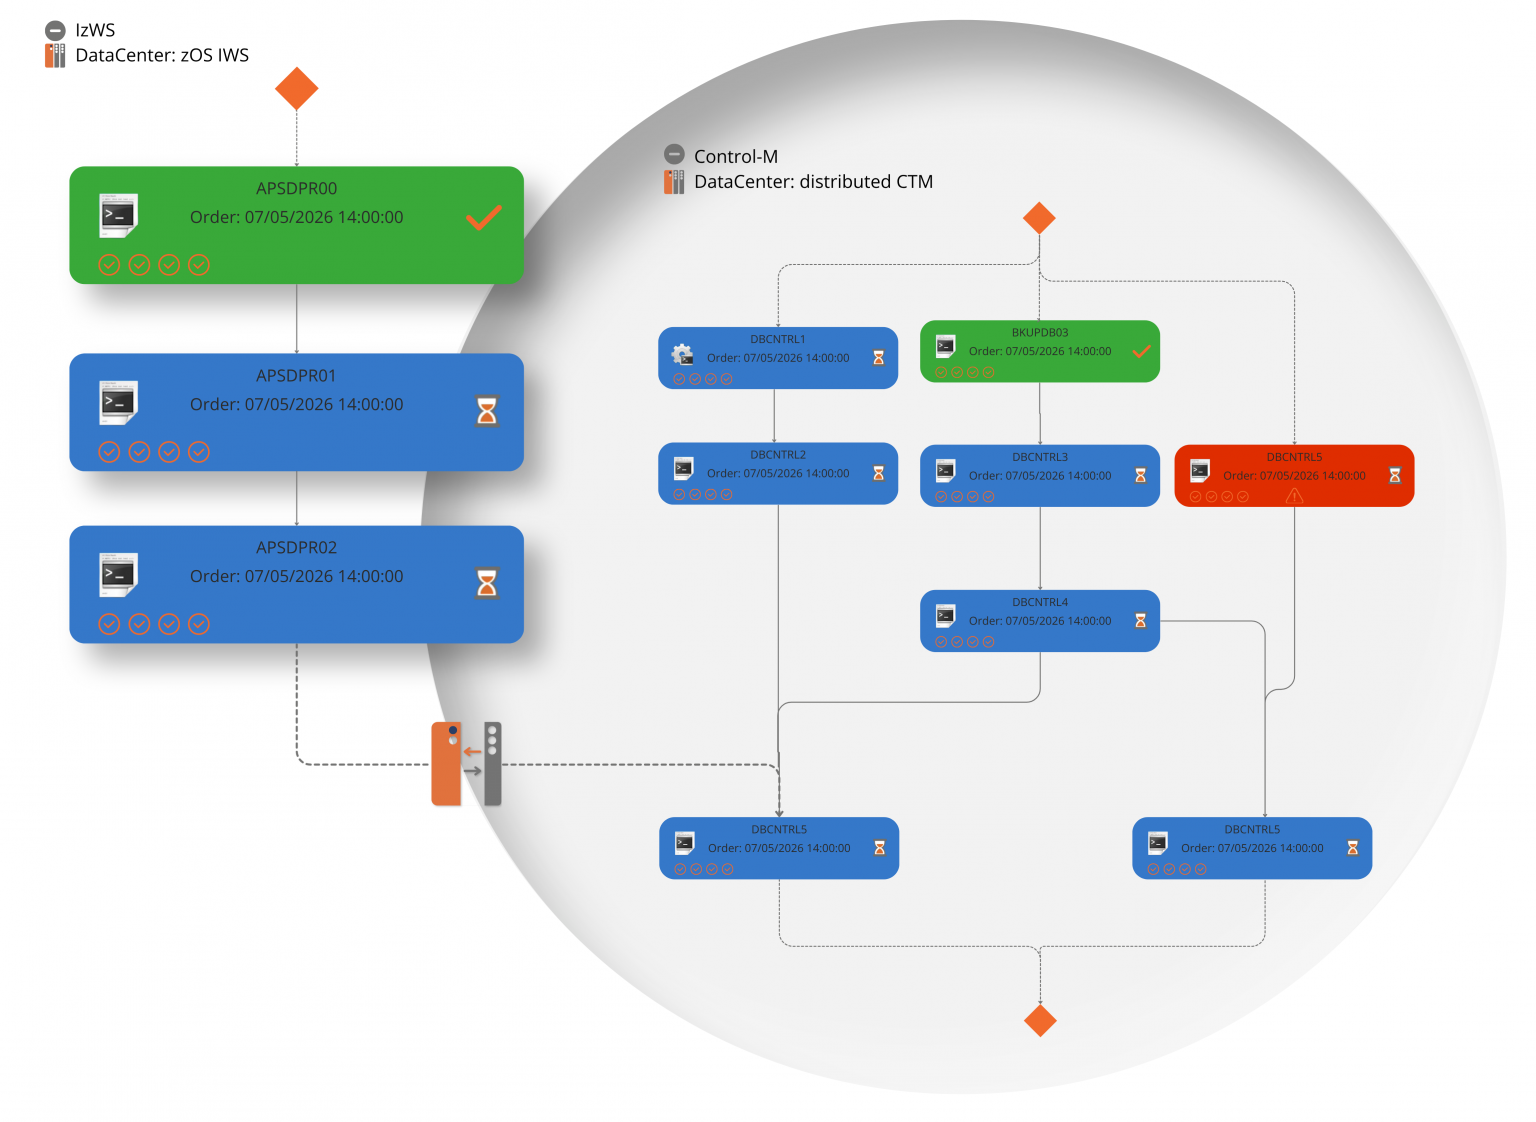
Each tool made sense on its own. Each team automated what they needed to. But across platforms, across schedulers, across teams, nobody has a single view of what’s running, what connects to what, or what breaks when something changes.

When something goes wrong, finding the cause means logging into multiple systems and reading through dense technical tables. It’s a governance and control gap. And it gets more expensive as the systems keep growing. That’s not just a functionality gap. That’s an operational risk.

observer graphic

BEFORE

Every scheduler has its own view. Nobody has the full picture.

Dependencies between schedulers stay hidden. Nobody sees how it all connects.

Root cause is manual and slow. Hours in logs across multiple platforms.

Business impact is invisible. Until it happens. 

AFTER

Unified dependency mapping. One map across every scheduler.

Cross-scheduler insights. In one place.

Quick issue detection. Issue traced in minutes vs. hours. 

Business impact awareness. See what a failure affects before it spreads. 

.

Gain what matters

Visibility

One view across all schedulers. See every job in a single interface.

Control

Know before you change. Easily view what connects to what.

Confidence

Changes without surprises. Trace failures across systems in record time.

Key features

apsware observer isn’t a replacement for your schedulers. It connects to your existing automation environment and adds the single pane of glass you’ve always been missing.

Process chain visualization 

Predecessors, successors, the full flow, graphical, not tabular. See a process as a process.

Cross-scheduler dependency mapping

Visual cross dependency maps, see what connects to what before a change, not after it breaks something downstream.

Real-time status across systems

Real-time status across all your schedulers in one interface, not in different applications.

Monitoring and alerting

Track critical processes across platforms in real time.

Root cause tracing

When a process fails, trace the cause across systems in minutes, not hours of manual investigation across disconnected logs.

Governance and access control

Define who can see and act on what across the full landscape.

Built beyond the limits
of existing solutions

Visualization, with optimized layout. Job mapping that is consistent and straightforward, no matter how complex. Horizontal or vertical mapping, dependencies are easy to trace.

Monitoring that doesn’t add to your infrastructure cost. apsware observer collects and aggregates data efficiently, only what’s needed, exactly when it’s needed. Visibility without the hidden infrastructure bill.

Performance that holds at scale. Most visibility tools work fine with a few jobs. apsware observer was built for high-volume automation landscapes from the start.

apsware observer as part of a bigger picture

You don’t need the full suite to start. The apsware observer stands on its own. But it’s built to fit into something larger as the questions you need to answer about your scheduling landscape grow.

DEFINITIONS

apsware discovery Logo

Understand and automatically document your job definitions before you look at what’s running.

REAL-TIME

Live process chains, cross-scheduler dependencies, status, and impact across everything you run.

HISTORICAL

apsware job request for Control-M and IWS/TWS

Understand performance trends, SLA history and the critical path of your scheduling landscape over time.

Visibility is the first step. Not the last.

You don’t need to commit to a full transformation to get started. apsware observer gives you clarity first and naturally connects to everything that can come next. Learn more about how we can support you with your enterprise automation.

FAQ

Everything you need to know about apsware observer.

No and that’s the point. apsware observer sits on top of your existing scheduler or orchestration environment as a visibility and monitoring layer. It connects to them, reads from them, and gives you a unified picture across all of them. Your setup keeps running exactly as it does today. No migration needed. 

apsware observer currently connects natively to IBM Workload Scheduler (OPC, TWS for z/OS, IWS for z/OS, IzWS), HCL Workload Automation for z/OS (HWAz) and Control-M. The support of Apache Airflow is currently under development. These cover the majority of enterprise scheduling and orchestration environments we see in practice — but we know this does not cover all.

We’re actively working on native support for Automic Workload Automation, with more integrations in the pipeline beyond that. If your environment runs something different, get in touch, we’ll give you an honest answer on where things stand and what’s possible.

Most environments are connected and returning live data within days. There is no lengthy onboarding process. apsware observer connects to your existing scheduler environments, and the view is available immediately or, depending on the underlying scheduling system, no later than when the daily plan is created.

It depends on the type of dependency. Jobs and workflows within each scheduler are tracked automatically, as they’re created, updated, or removed in the tool itself. apsware observer reflects those changes without any manual intervention. You’re always looking at a current picture of what’s actually running.

Cross-scheduler dependencies — the connections between jobs running across different schedulers and orchestration tools — are set up once manually. That’s a one-time configuration effort, not an ongoing maintenance task. Once those cross-system relationships are defined, they can be monitored from there.

No, apsware observer is read-only by default. It observes and surfaces, it does not write to, trigger, or modify jobs or configurations in any connected scheduler.

apsware observer’s data layer was built for high-volume automation landscapes from the start. The architecture handles large numbers of concurrent jobs across multiple schedulers. For IzWS/HWAz users: You don’t need to worry about high MIPS consumption during the data collection process.

Pricing is based on the scale of your environment, the number of schedulers, platforms, and workload volume.  We don’t publish a pricing page because the costs depend on your setup. 

apsware observer comes with a built-in role-based access control. Connection to Active Directory and LDAP is supported and recommended. You define who can see what across the full landscape and who can see particular job details. This matters particularly in multi-team environments where different teams own different schedulers but need shared visibility without shared access.

Native scheduler interfaces show you what’s happening inside that scheduler. They don’t show you what connects across schedulers and that’s where most operational blind spots live.

When a job in Control-M depends on a workflow completing in IzWS, neither tool shows you that relationship. When something breaks in that chain, you’re correlating information across multiple interfaces manually. apsware observer gives you the cross-system picture that no individual scheduler can provide — one view of the full dependency chain, regardless of where each job runs.

Nevertheless, some scheduling environments provide limited graphical real-time visualization of the automated processes. apsware observer overcomes these limitations.  

Since apsware observer is a read-only layer on top of your schedulers, it never writes to or modifies your scheduler environments. Any changes to jobs and workflows happen directly in your schedulers, where they’re already covered by the audit mechanisms of those systems. apsware observer simply reflects those changes automatically – so there is nothing to log on the change side. 

Onboarding is structured to get you operational quickly without creating a long-term dependency on apsware. The initial setup — connecting to your schedulers and configuring cross-system dependencies — is guided by our team. From there, your team takes the wheel. The interface is built for people who work in scheduling environments daily, so the learning curve is short. apsware stays available as a partner, but the goal from day one is that your team owns it.

No. apsware has no built-in access to your observer environment. Once deployed, your environment is yours — only users with valid login credentials can access it. apsware cannot log in, view your data, or access your scheduling landscape without being explicitly granted credentials by you. If you ever need apsware support to look at something directly, that’s a deliberate action on your side — you share access, it doesn’t exist by default.

When something breaks, the observer shows you the failed job in the context of its full chain — what ran before it, what was supposed to run after it, and what’s now blocked or at risk downstream. You see execution history, the last successful run, and exactly where in the process the failure occurred — across all schedulers in one place. Root cause investigation that typically requires correlating logs across multiple tools is consolidated into a single view, significantly reducing time to resolution.


Still have a question?

Book a demo

Curious what apsware observer could look like in action? Let us show you.

Talk to us

Not sure where to start? Talk to us. We’ll help you find the right first step in.

apsware observer
demo request