apsware analytics for Control-M
Control-M reporting and metrics within everyone’s reach
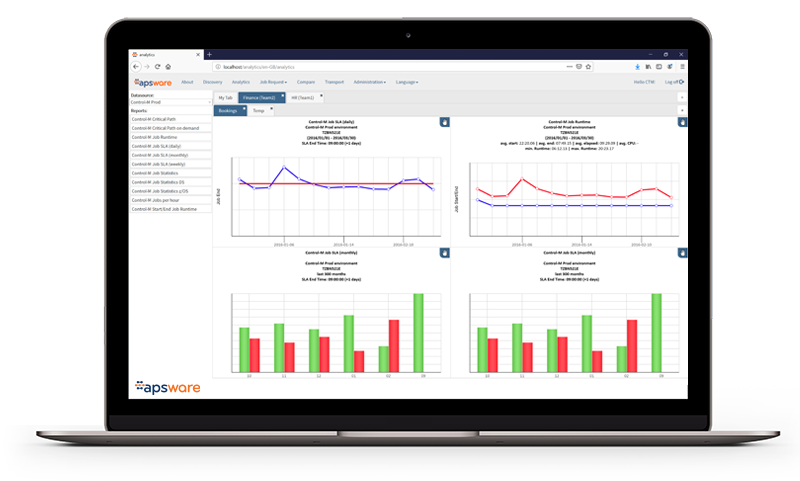
apsware analytics for Control-M collects and visualizes the data which helps you to better manage your business processes automated via Control-M. With a few clicks, meaningful views, metrics and reports are created by everyone. Results can be shared via a dashboard, so that everyone who needs to know is informed. This new level of transparency allows you to take Control-M automation to a higher level.
SLA reporting
Processes automated via a digital automation solution such as Control-M are vital to your companies daily operations and overall success. When SLA’s have not been met, there can be significant financial and other consequences, therefore knowing the SLA status history is crucial.
With apsware analytics everyone who needs this information can self-service themselves and quickly produce answers without involving a Control-M expert. Whether they need SLA compliance metrics on a monthly, weekly or daily basis, apsware analytics aggregates and presents concise SLA reports quicker and more accurately than ever before. Users may even drill-in and dive deeper whenever required.
Critical path
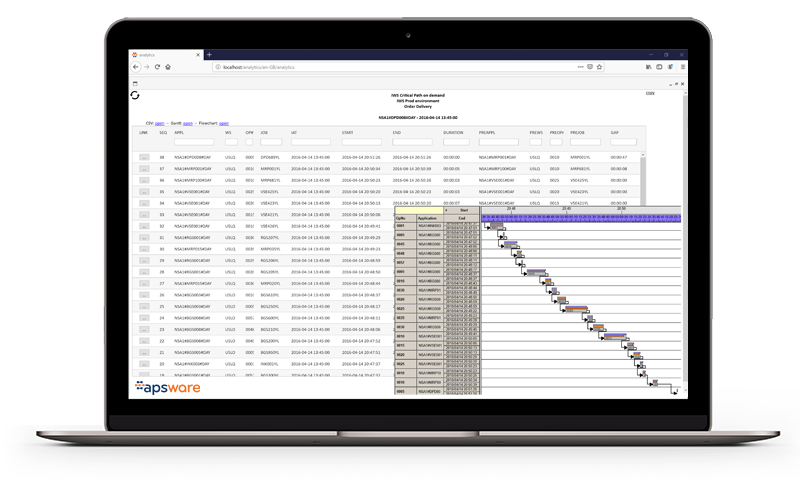
If an automation process was not completed in time (SLA violation), you need to identify the root cause of the delay as soon as possible and fix it in order to avoid future negative business impact. Finding the root cause of the delay in complex environments with many job dependencies is a labor intensive task, which normally requires expert level knowledge.
apsware analytics can automatically identify and visualize the critical path to a specific Control-M job. The critical path root cause analysis can be performed by everyone within minutes. Saving valuable research time, helping to mitigate future risk. Better, faster and easier than other means of collecting and reporting on this time sensitive data.
apsware analytics for Control-M - The missing Link
Long-term job history
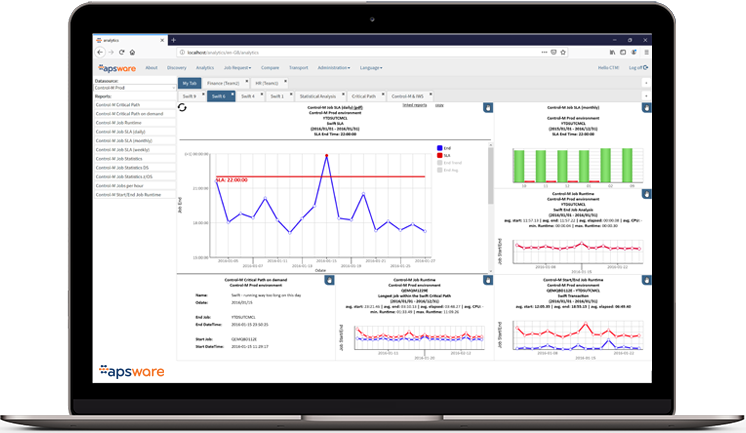
In a typical Control-M environment, you are collecting job history for a few days. apsware analytics overcomes this limitation and collects and normalizes automation run-time statistics and structures for weeks and years. Based on this solid data foundation, you may analyze and visualize your automated business processes faster than ever before.
With just a few mouse clicks any user with minimal knowledge of Control-M or automation can see meaningful reports, KPI’s, metrics and views in seconds. Reporting results can be securely shared via a dashboard based on groups or individual users preferences. This new level of transparency allows better communication and elevates Control-M to a higher level of corporate visibility, uniquely supporting devops and agile enterprise analytics requirements. Freeing your IT staff or consultants from tedious data collection and reporting tasks.
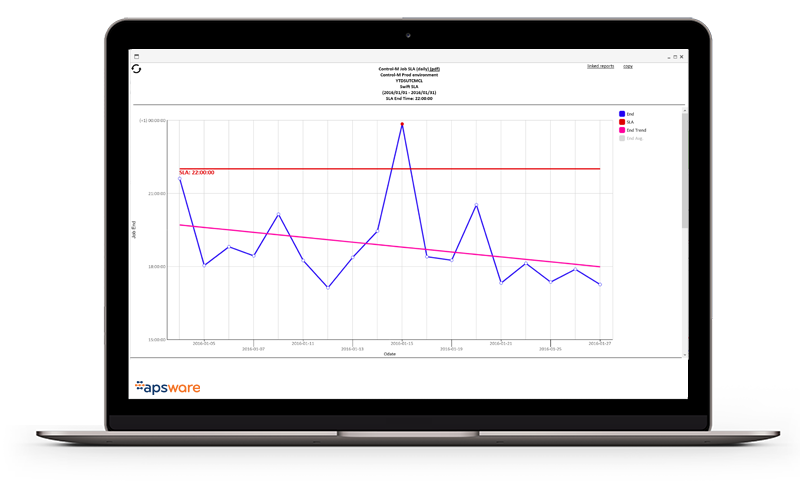
Trend Analysis
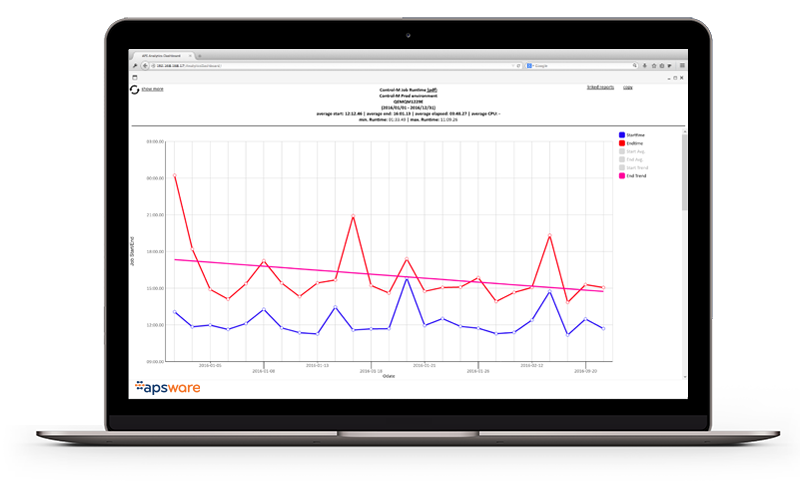
How has a job performed over the previous years or months? When has it started? When has it ended? What is the average duration? Is the job duration growing or shrinking? When did a job have an unusually short or long duration, or other anomalies? apsware analytics provides out-of-the box reports to answer these questions immediately.
Metrics
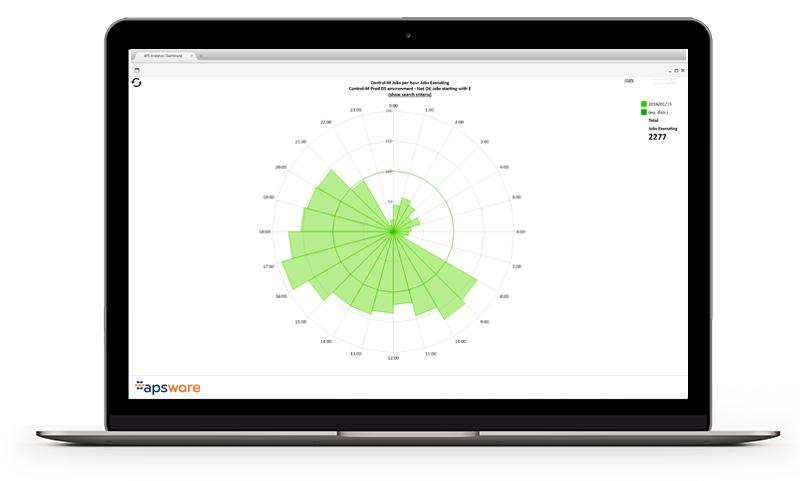
How many jobs have executed yesterday, over last x days or within a range of days. Numerous filter options on jobnames, jobstatus and other key parameters are available to define meaningful metrics and dashboards, right out of the box, users simply point click and report.

Audit and Compliance
You’ve got questions? Talk to an apsware analytics for Control-M expert
Self-Service Dashboard
The power of sharing reliable data.