.
.
.
.
.
.
.
.
.
apsware visualjob for Control-M
Digital Automation Analytics for Experts: Understand and improve your Control-M schedules
apsware visualjob for Control-M aggregates the scheduling definitions and job runtime statistics of your Control-M environment and visualizes the result in an understandable and meaningful way.
All aspects of high-quality flow-charting, cross referencing, quality assurance, forecasting, statistical reporting, workload analysis, workload simulation, critical path analysis and critical path simulation for Control-M are available within one integrated solution.
Automation experts can now gain reliable information and perform root-cause analysis, replacing labor-intensive information gathering and professional estimates.
visualjob is the most advanced Workload Analytics solution for Control-M available today and is essential for the effective management of your Workload Automation environment.
Features
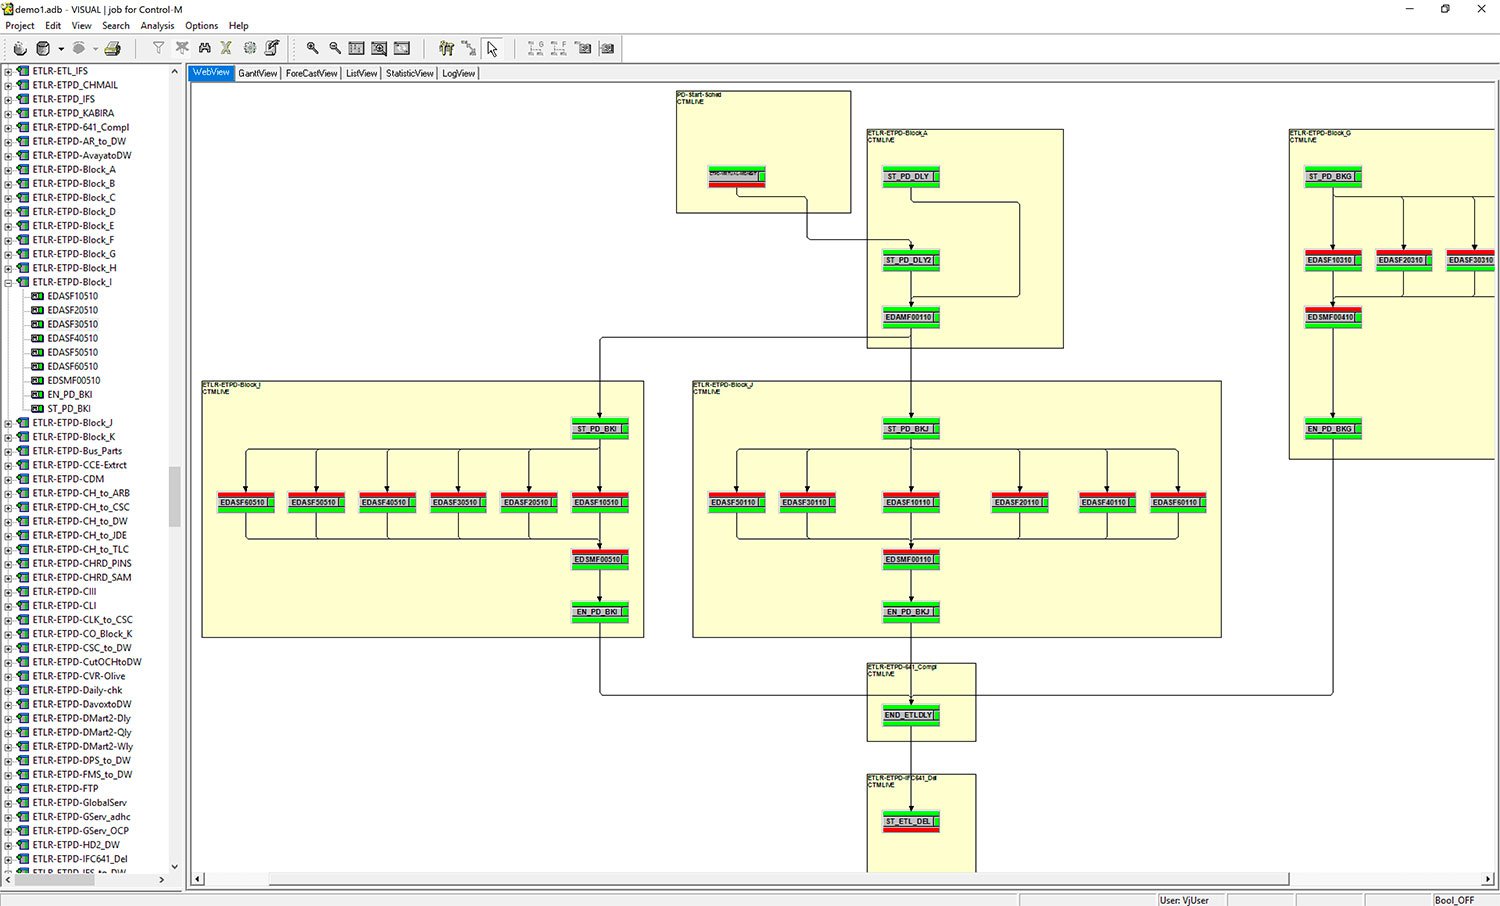
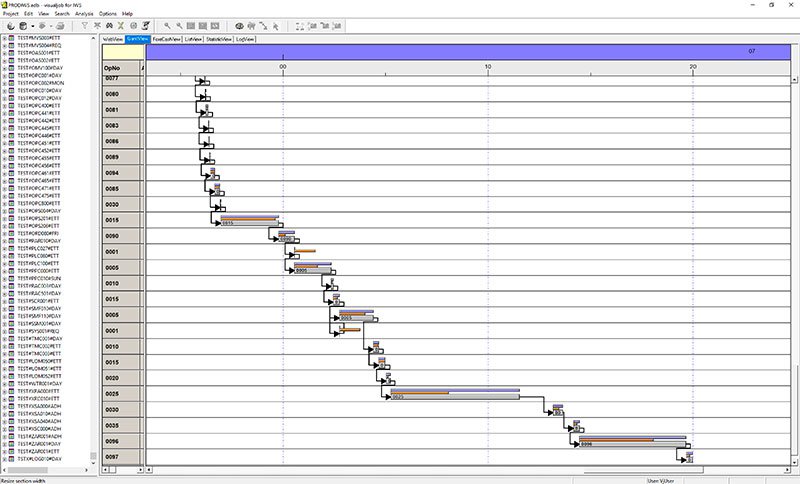
Flowcharting
apsware visualjob for Control-M provides unmatched graphical flowcharts for Control-M.
Complex relationships between jobs and folders are presented in an easy and understandable visualization, not only reducing the time it takes to understand the existing environment, but also pinpointing potential problems and avoiding downtime.
The visualjob flowcharts are completely customizable allowing the user to only focus on those jobs and workflows that are important for the current scope of analysis. Using graphical clustering, the assignment of operations to folders, applications and sub-applications remains clear at all times. External dependencies from the selected view can be expanded and stepped through. Different types of dependencies like OK, NOTOK, Condition Code, MAYBE etc. are color coded and simplify the analysis of complex environments.
Flowcharts can be exported in standard image formats and printed.
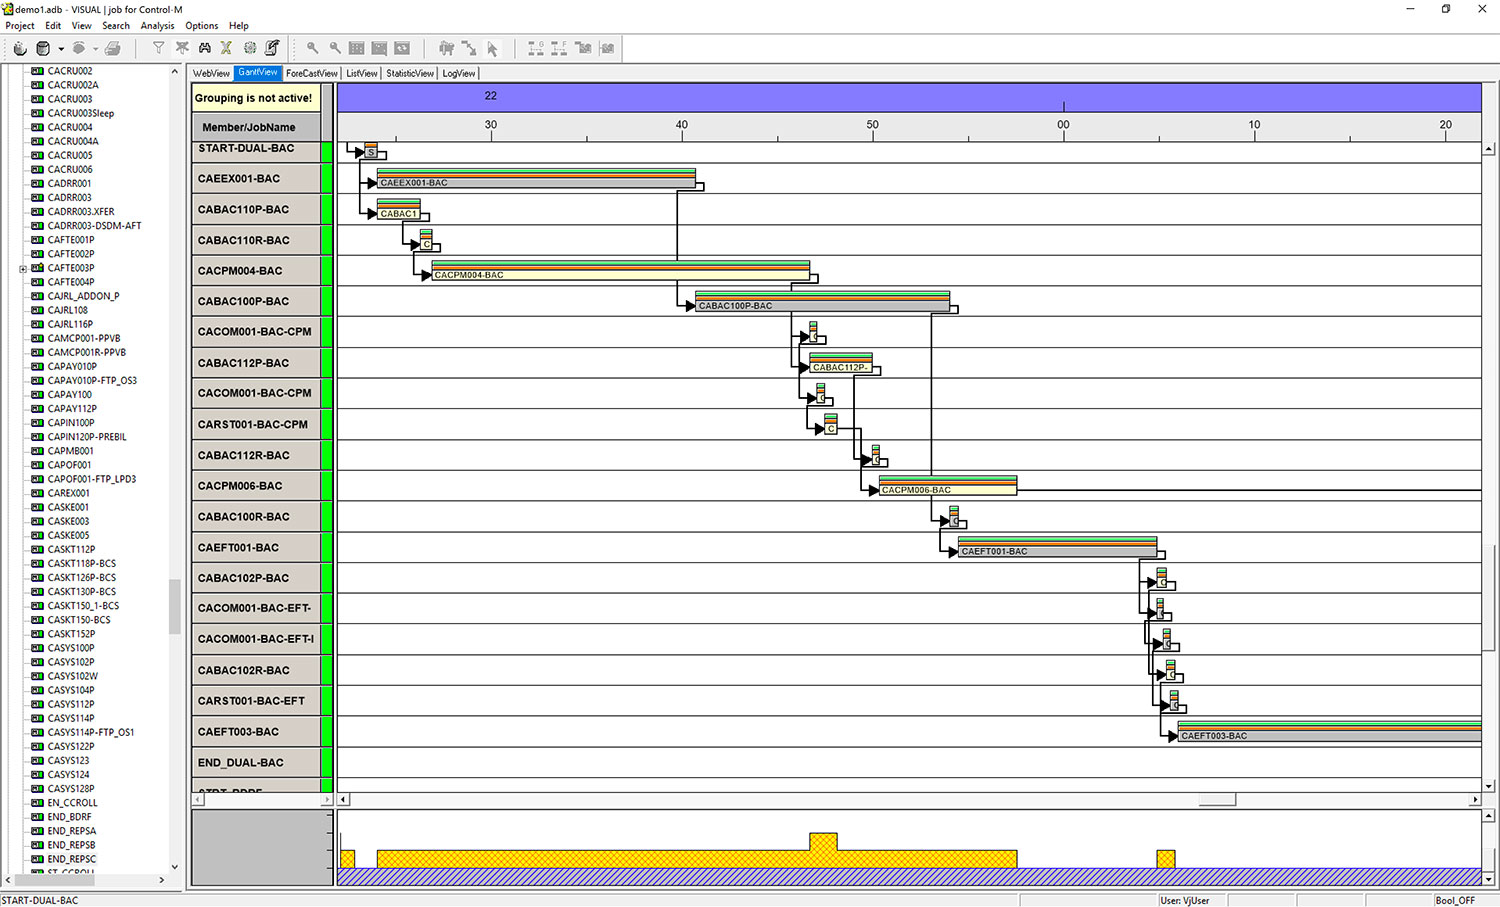
Creating Images and Printing
Creation of graphics, prints, PDFs and/or MS VISIO of the job flows facilitate accurate communications between interrelated departments and better documents the business processes that Control-M supports.
Any graphical view, flowchart, ForecastView or Gantt chart, can be exported to one of several image formats, printed, saved as a PDF or imported into Microsoft Office VISIO.
When printing to a printer or plotter, users have the option of scaling the image or specifying the layout of the pages in width and height. You can print to any size of paper, on any Windows-compatible printer, plotter or PDF writer.
visualjob for Control-M supports exporting to the following formats: PNG, GIF, JPG/JPEG, TIFF, BMP, WMF, EMF and EMF+.
Would you like to avoid manual painting of Control-M flowcharts with Microsoft Office Visio? The EMF format generated by visualjob for Control-M can easily be imported to Microsoft Office VISIO. The ability to print and create images of the Control-M job flows and Gantt charts facilitates better communications between production control staff and other departments.
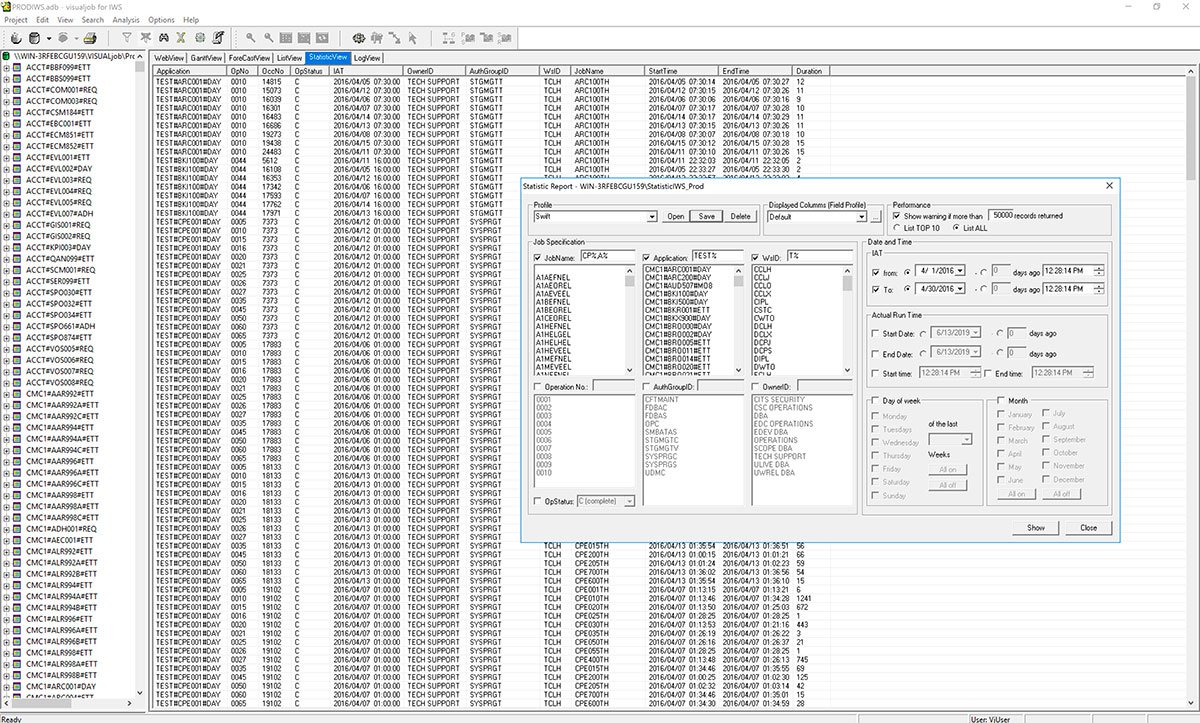
Cross Reference Reporting
Searching for criteria within the schedule and generating dynamic reports could not be easier. The cross referencing facility offers a powerful reporting tool with an easy to use interface; without requiring individual coding skills or proprietary language.
Virtually any combination of fields within Control-M (including variable names and variable values) can be used as search and reporting criteria. The output of visualjob reports can be in a user-designed spreadsheet and/or in a graphical flowchart. Textual output can be exported to Microsoft Office Excel and the graphical output can be exported to several image formats for documentation, posting on an inter-/intranet site or delivery to a requestor. Templates for the report criteria and report layouts can be created and shared, facilitating the quick re-generation of reports referencing the then current data.
Key strength of visualjob for Control-M is that results generated with the Cross Reference Reporting can be further qualified with – for example – the integrated visualjob for Control-M forecast function. With this, questions like “Which jobs meet specific criteria and are planned for execution for next Sunday?,” are easily answered.
Critical Path Analysis

Long Term Job History

Structure of the Control-M Active Environment
Statistical Reporting

Workload Analysis

Workload Simulation
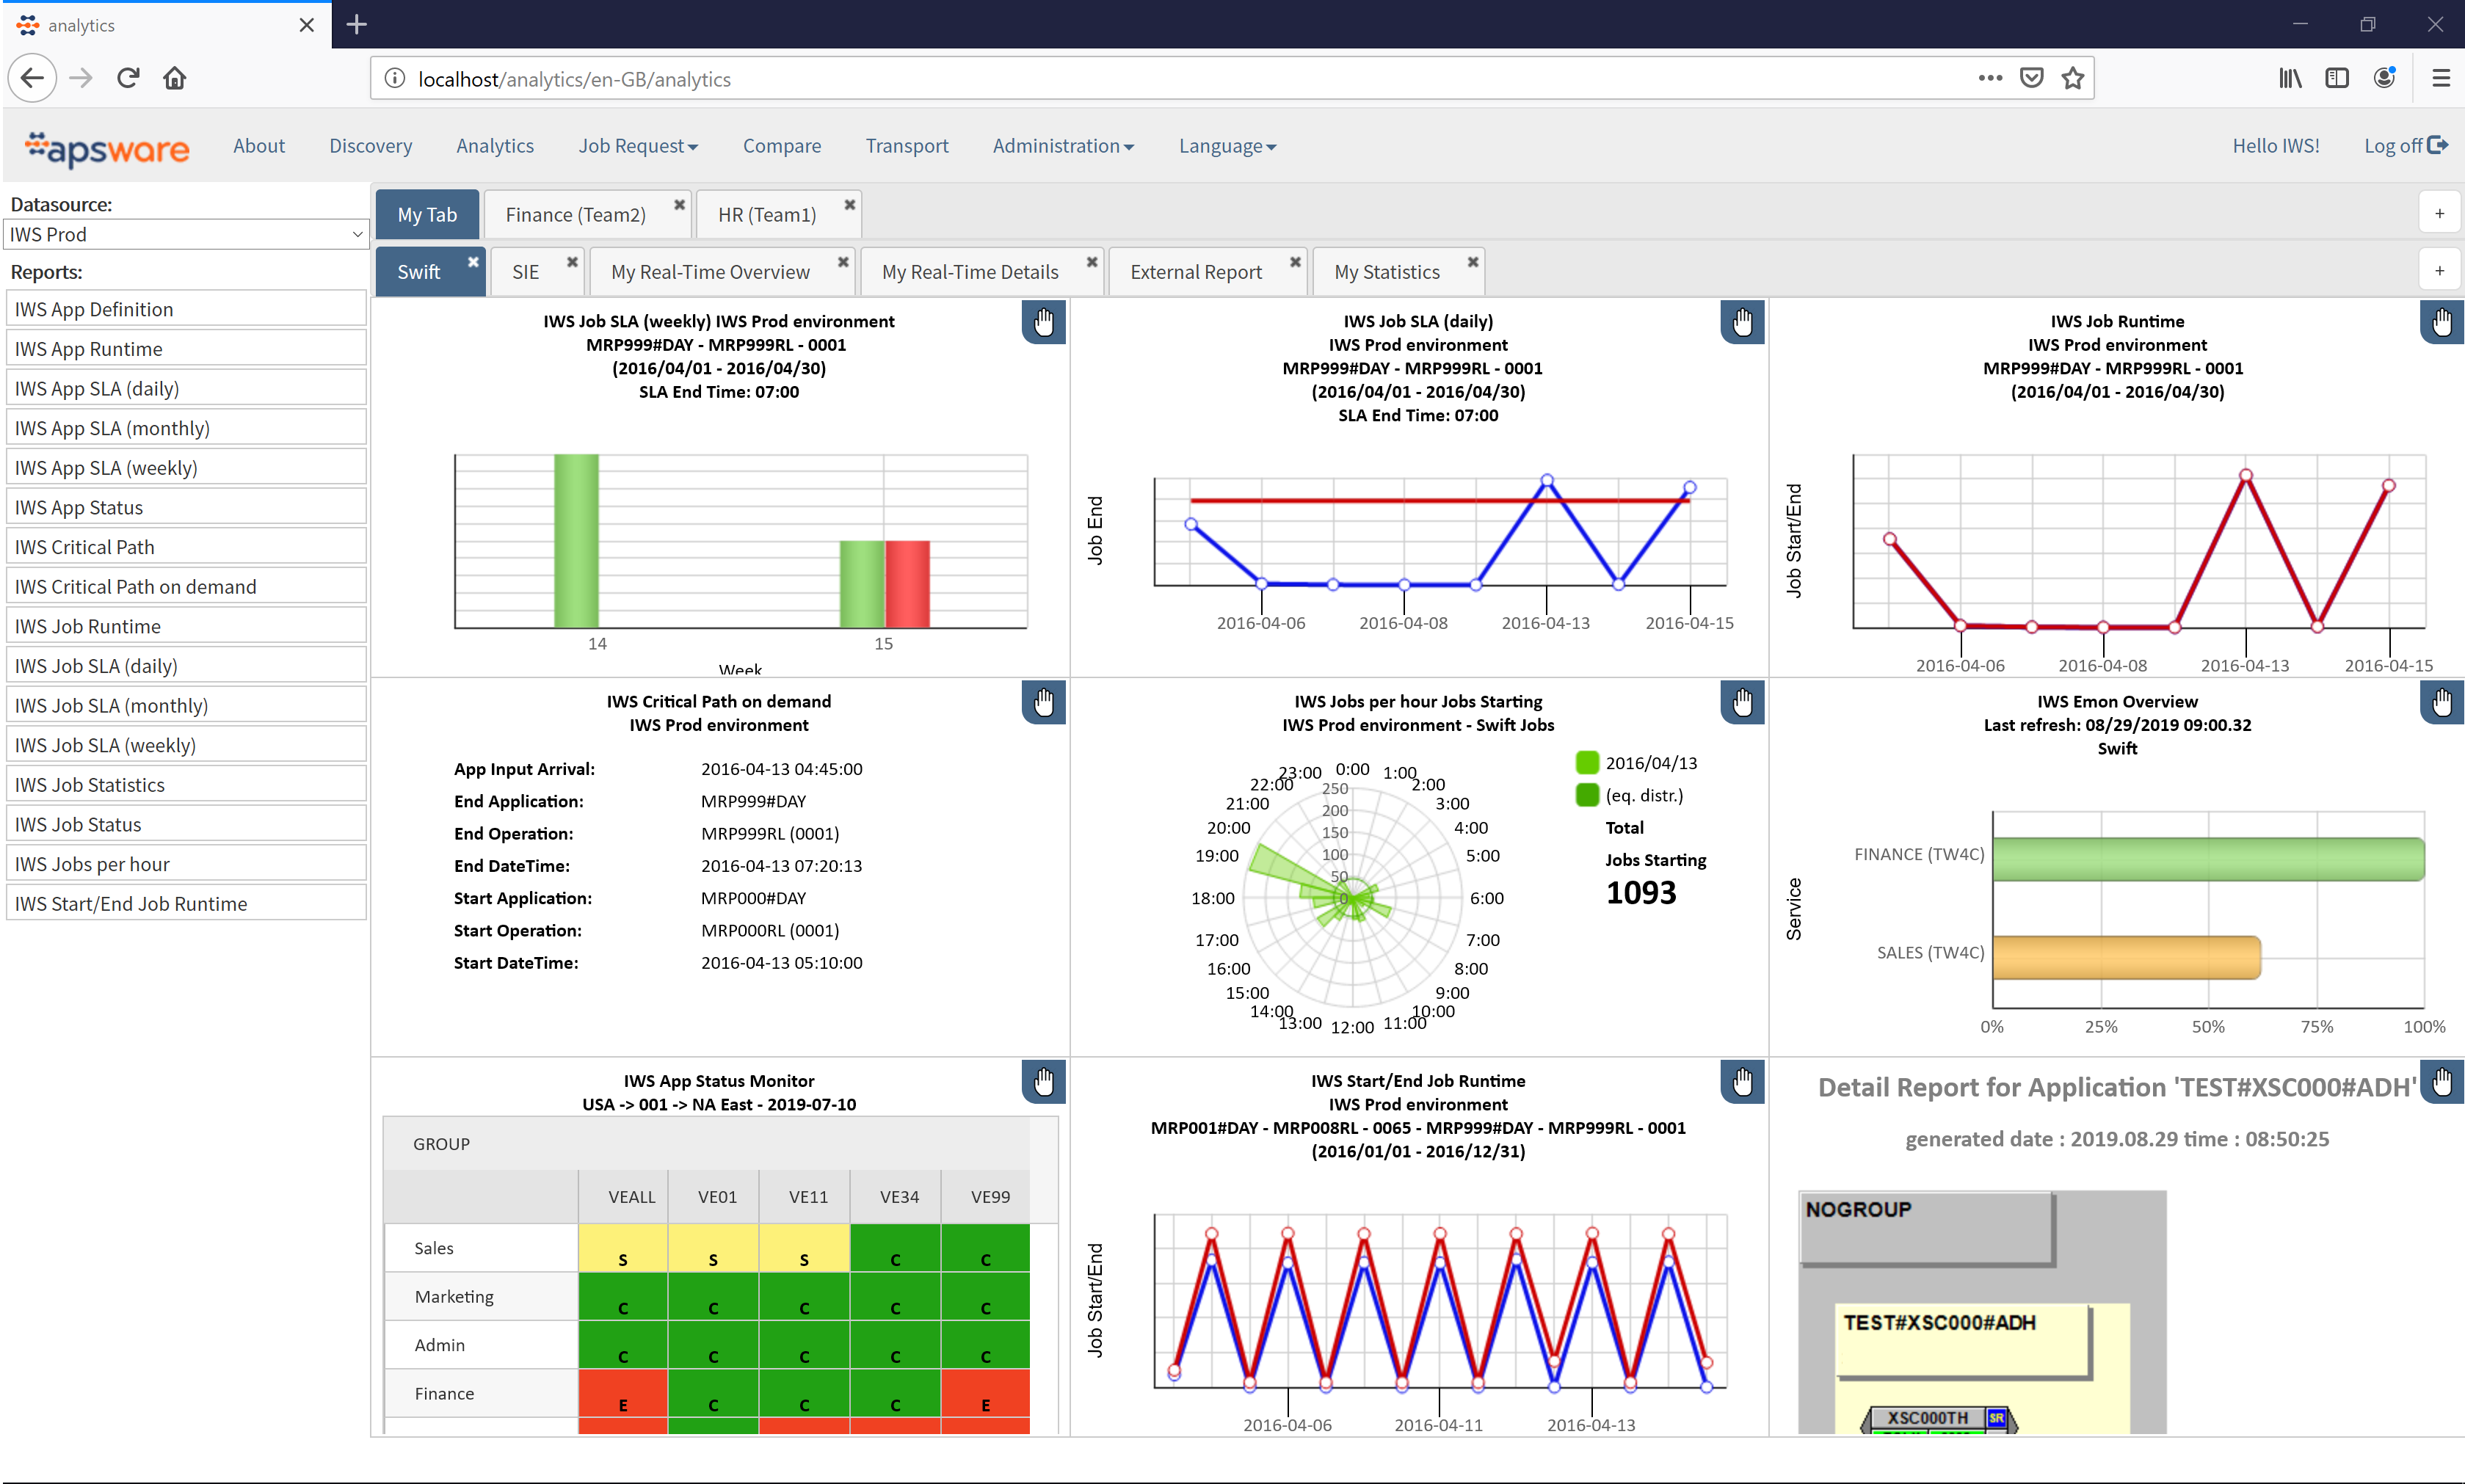
Integration with apsware analytics
Digital Automation Analytics for Self-Service users
Automation runs your digital business. Meaningful metrics need to be within everyone´s reach. Through the integration of visualjob with apsware analytics for Control-M, the power of Digital Automation Analytics is now also available for Self-Service users.