apsware visualjob for IWS
Expert visual analysis to understand and optimize your IBM Workload Scheduler for z/OS workflows
apsware visualjob aggregates the scheduling definitions and job run-time statistics of your IBM Workload Scheduler for z/OS and End to End (IWS, formally TWS Tivoli Workload Scheduler) environment and visualizes the result in an understandable and meaningful way.
All aspects of high-quality flowcharting, cross referencing, forecasting, scheduling design, quality assurance, statistical reporting, workload analysis, workload simulation, critical path analysis and critical path simulation for IWS are available within one integrated solution.
Automation experts can now gain reliable information and perform root-cause analysis and workload simulations quickly, replacing labor-intensive information gathering and professional estimates; faster and more accurately then ever before.
apsware visualjob is the most advanced Workload Analytics solution for IWS available today and is essential for the effective management of your Workload Automation environment.
apsware visualjob for IWS - Features
Flowcharting with apsware visualjob for IWS
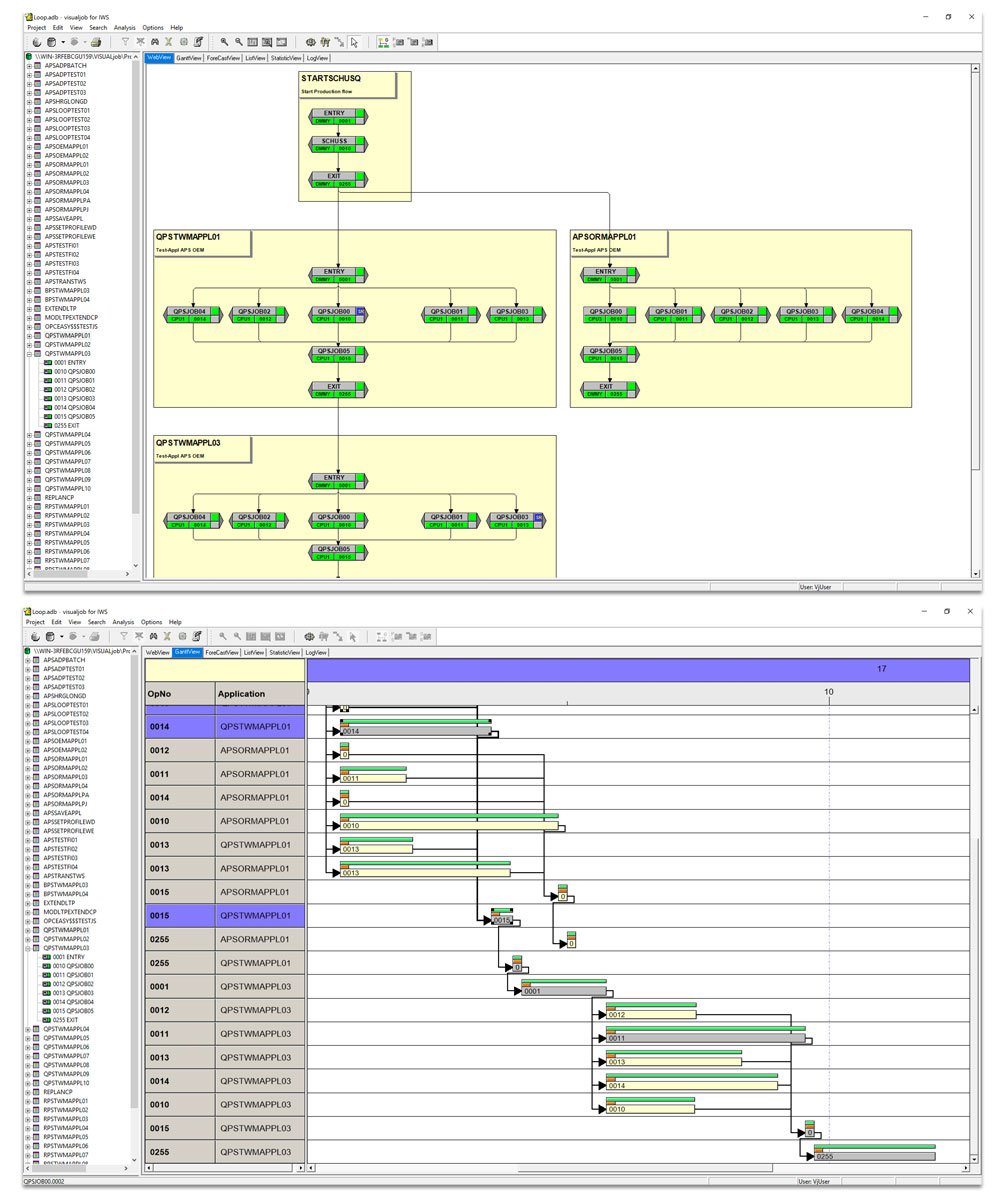
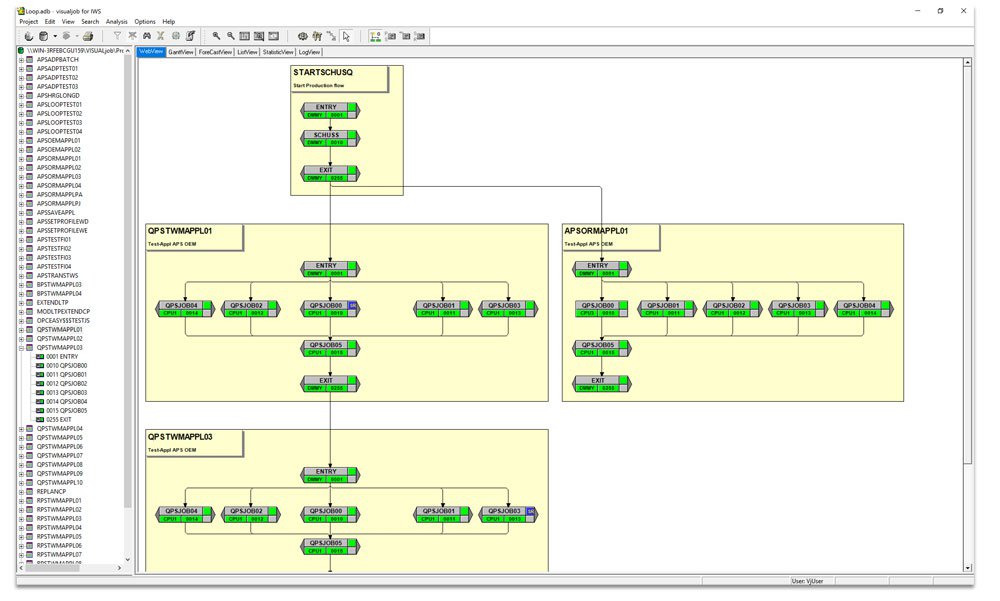
apsware visualjob for IWS provides unmatched graphical flowcharts for IWS.
Complex relationships between operations and applications are presented in an easy and understandable visualization, not only reducing the time it takes to understand the existing environment, but also pinpointing potential problems and avoiding downtime. All IWS parameters are supported.
Using graphical clustering, the assignment of operations to applications and groups remains clear at all times.
External dependencies from the selected view can be expanded and stepped through. Elements like conditional dependencies and application dependencies are also supported in the graphic view.
Creating Images & Printing
Creation of graphics, prints, PDFs and/or MS VISIO of the job flows facilitate accurate communications between interrelated departments and better documents the business processes that IWS supports.
Any graphical view, flowchart, ForecastView or Gantt chart, can be exported to one of several image formats, printed, saved as a PDF or imported into Microsoft Office VISIO.
When printing to a printer or plotter, users have the option of scaling the image or specifying the layout of the pages in width and height. You can print to any size of paper, on any Windows-compatible printer, plotter or PDF writer.
apsware visualjob for IWS supports exporting to the following formats: PNG, GIF, JPG/JPEG, TIFF, BMP, WMF, EMF and EMF+.
Would you like to avoid manual painting of IWS flowcharts with Microsoft Office Visio? The EMF format generated by apsware visualjob for IWS can easily be imported to Microsoft Office VISIO. The ability to print and create images of the IWS job flows and Gantt charts facilitates better communications between production control staff and other departments.
Cross Reference Reporting
Searching for criteria within the schedule and generating dynamic reports could not be easier. The cross referencing facility offers a powerful reporting tool with an easy to use interface; without requiring individual coding skills or proprietary language.
Virtually any combination of fields within IWS (z/OS and End to End) can be used as search and reporting criteria. The output of visualjob reports can be in a user-designed spreadsheet and/or in a graphical flowchart. Textual output can be exported to Microsoft Office Excel and the graphical output can be exported to several image formats for documentation, posting on an inter-/intranet site or delivery to a requestor. Templates for the report criteria and report layouts can be created and shared, facilitating the quick re-generation of reports referencing the then current data.
Cross Reference Reports can be further qualified with – for example – the integrated visualjob for IWS forecast function. Questions like “Which jobs meet specific criteria and are planned for execution for next Sunday?,” and many other queries are easily answered.
Forecasting
Faulty planning can lead to disruptions and delays in production. In order to visualize the schedule or discover possible planning mistakes while designing the job net, visualjob for IWS provides robust IWS forecasting functions.
visualjob for IWS can forecast at any level, from the individual application / operation or the entire schedule. The IWS forecast can be performed for a specific day or a range of dates. The output can be a flowchart, Gantt chart or spreadsheet.
Critical Path Analysis
What is the root cause of a Service Level violation? And how long does it take to complete this research?
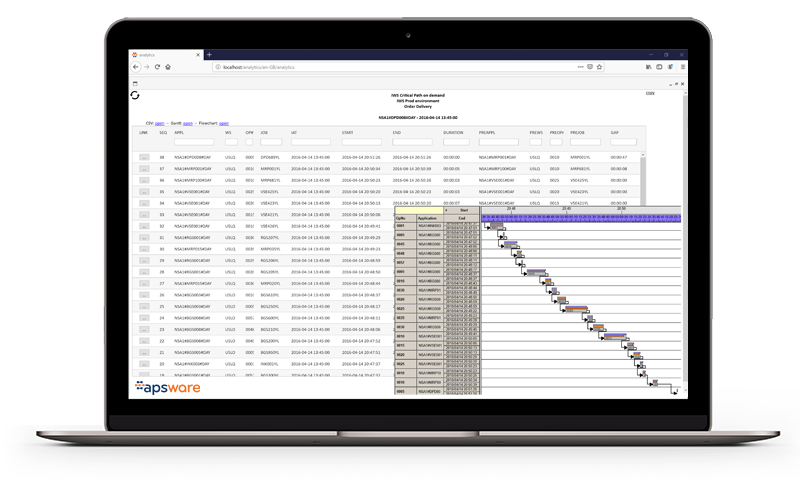
apsware visualjob for IWS provides unique capabilities to identify the longest path (aka. Critical Path) to a timely critical job. The research takes a few seconds versus hours and provides a clear understanding about which job in a complex chain of predecessors has caused the delay of the entire downstream process flow.
You can finally find the root cause of a delay quickly and avoid future violations of Service Level Agreements (SLA). The critical path analysis can even be utilized by non-IWS experts via

Loop Analysis and Detection
A loop within the schedule can have disastrous consequences on the production environment.
apsware visualjob for IWS makes it easy to detect the root cause of a loop.
How?

Automated Documentation
Who likes proper documentation? Everyone.
Who likes to write documentation? Nobody!
With apsware visualjob, you can solve this problem immediately. With a click of the mouse or through an automated batch job, detailed documentation in HTML-format will be generated automatically, containing information about all IWS definitions, including graphical flowcharts.
Now audit compliance and D/R documentation of production is easier, more accurate and up to date than ever before!
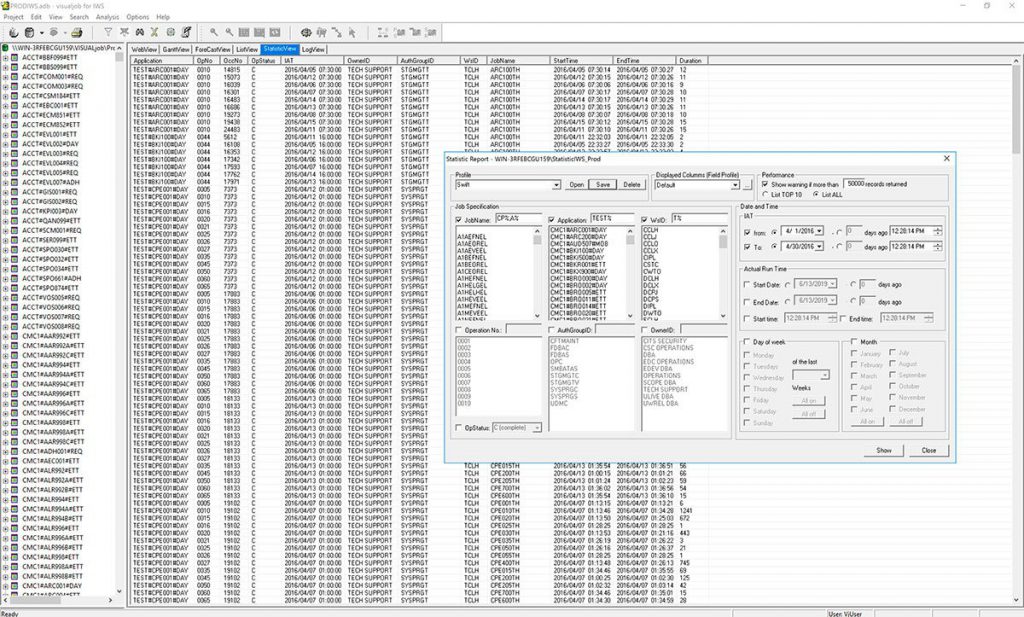
Statistical Reporting
Free form reports can easily be generated utilizing statistics collected from past IWS batch executions. Robust filtering criteria can be used to narrow the focus of reports based upon criteria such as dates, times, day of week, applications, operations, workstations, job status, and more.

Workload Analysis
apsware visualjob for IWS enables the user to visualize past executions in a Gantt chart, based on the actual runtime information collected in the statistical database.
This provides an excellent graphical overview about how processes have performed in the past and as compared to their average performance.

Workload Simulation
When there is no way to accurately simulate the effects of an added load to a job flow or longer/shorter job durations within a flow, service levels are difficult to define.
apsware visualjob for IWS provides comprehensive workload simulation functions with graphical support through the Gantt chart to perform resource utilization and proactive analysis.
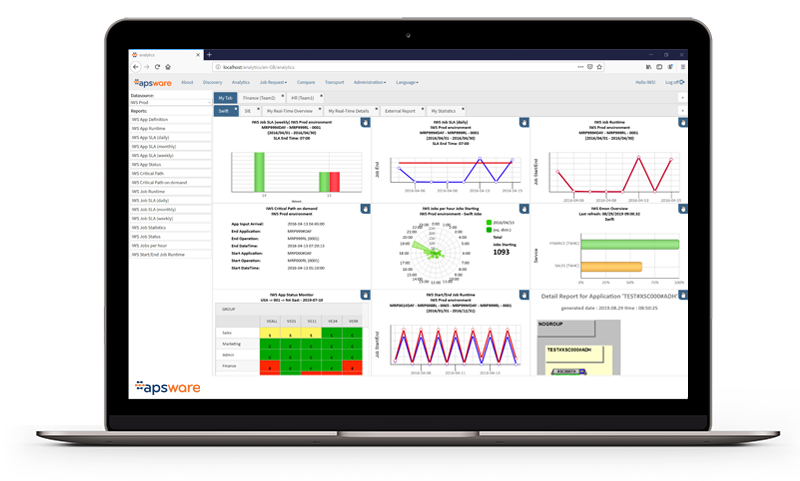
Integration with apsware analytics
Self-Service Analytics for IBM Workload Scheduler for z/OS
Automation runs your digital business. Meaningful metrics need to be within everyone´s reach. Through the integration of visualjob with apsware analytics for IWS, the power of Digital Automation Analytics is now also available for Self-Service users.
